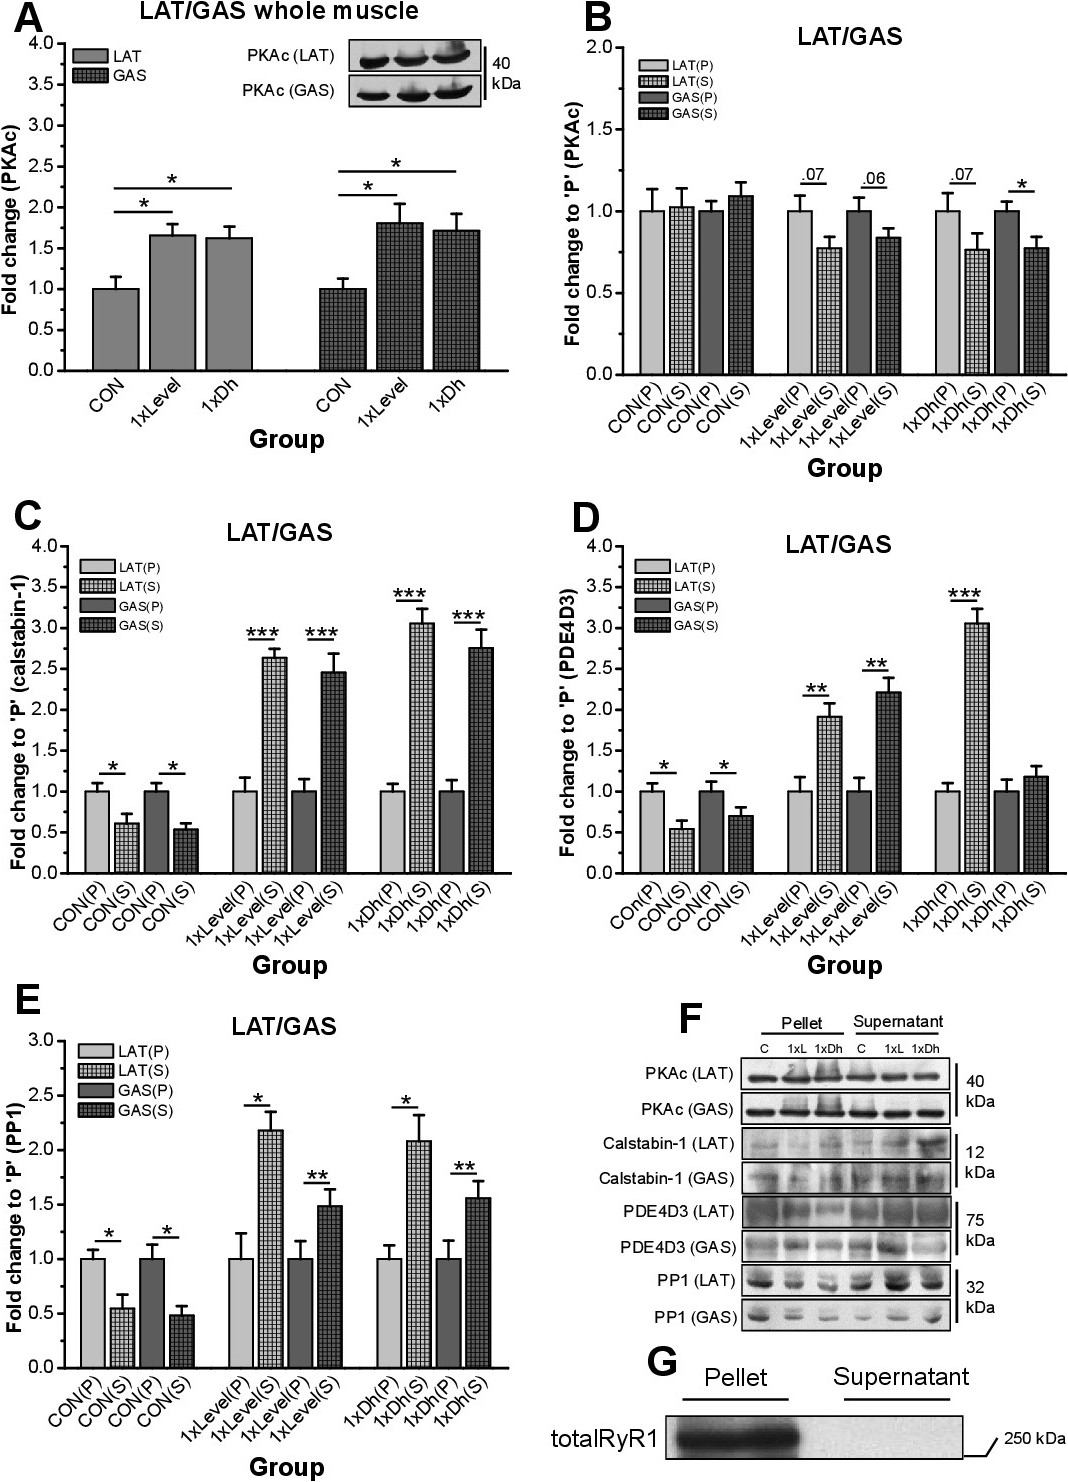
Fig. 4. PKAc, calstabin-1, PDE4D3, and PP1 regulations in LAT and GAS muscles after exercise. (A) Regulation of PKAc levels by exercise stimuli in LAT and GAS muscles. PKAc levels increased significantly after exercise programs in both muscles. Representative western blot bands are shown for PKAc (40 kDa) in both muscles. GAPDH (36 kDa) served as internal loading control (not shown). Fold changes of PKAc (B), calstabin-1 (C), PDE4D3 (D), and PP1 (E) levels in pellet and supernatant of LAT and GAS muscles relative to CON. In (B) no changes between CON pellet and supernatant were observed; however, both exercise modes resulted in a strong tendency toward increased PKAc levels in LAT pellets compared to supernatants (p=0.07 for each condition) while 1xDownhill running resulted in significantly increased PKAc levels in GAS pellets compared to supernatants. In (C), CON calstabin-1 levels were significantly higher in the pellet than in the supernatant; however, after 1xLevel and 1xDownhill stimulations, calstabin-1 levels were significantly higher in the supernatant than in the pellet. In (D), CON PDE4D3 levels were significantly higher in the pellet than in the supernatant; however, after 1xLevel and 1xDownhill stimulations, PDE4D3 levels were significantly higher in supernatant than in pellet. In (E), CON PP1 levels were significantly higher in the pellet than in the supernatant; however, after 1xLevel and 1xDownhill running, PP1 levels were significantly higher in the supernatant than in the pellet. (F) Representative western blots are shown for PKAc (40 kDa), calstabin-1 (12 kDa), PDE4D3 (75 kDa), and PP1 (33 kDa) for CON, 1xLevel and 1xDownhill conditions in pellets and supernatants of LAT and GAS muscles. (G) Western blot of total RyR1 in CON condition in pellet and supernatant of LAT muscle demonstrates that the approach of SR-enriched microsome preparation was successful. * p<0.05, ** p<0.01, *** p<0.001, P = pellet, S = supernatant. n(western blot experiments) = 4 for each tested condition.